The Albemarle bear boom
County harvest records show a recent rise that climate and timberland do not explain. North Carolina's 1971 sanctuary system fits the timing and mechanism better.
the question
An 880 lb male black bear was taken near Vanceboro in Craven County in 1998. It still stands as the world record, according to NCWRC’s black bear profile. That is close enough to Albemarle Sound that I got curious about the rest of the coastal plain.
Was this mostly weather and cropland, or had North Carolina built the conditions for a bear boom? I pulled five coastal counties with long records, then added Haywood and Jackson as mountain comparisons.
where the data comes from
The spine is NCWRC’s annual bear reports, which give county harvest and Bear Management Unit (BMU) weight summaries. I joined each county-year to NOAA GHCN-Daily station records and USDA NASS crop data. Weather becomes growing-degree-days above 10°C and frost-free days. I kept April-September precipitation too, then put crop acreage and reported yield beside harvest.
The join covers 1997-2023. Hyde and Tyrrell need regional proxy stations because neither has an in-county GHCN station. Weight stays at BMU level. The explorer keeps those limits visible.
what the harvest record shows
At first the line is almost boring. The seven counties average about 457 harvested bears per year from 1997 through 2001. Then comes an unbroken climb, from 463 in 2002 to 1,160 in 2023. Across the full record, 443 becomes 1,160, a 2.62× increase and about 30 more harvested bears per year.
Every county rises, but the coastal plain does most of it. Recent three-year means are 292 in Hyde, 246 in Beaufort, 218 in Tyrrell and 122 in Washington. Dare averages 18 because much of the county is federal refuge land with restricted hunting. Haywood reaches about 142 and Jackson 74 from near zero.
Harvest is not population. Bait and season rules changed in 2014, 2016 and 2018, so some of the climb reflects more opportunity to hunt.
the climate signal
Growing-degree-days are tempting. They correlate with harvest at r = +0.50 to +0.74 in Tyrrell, Hyde, Jackson and Washington. But they also trend upward by 8.7 to 17.1 degree-days per year. Two lines rising together is not the same as warm years producing more harvested bears.
Frost-free-day correlations run from -0.29 in Beaufort to +0.51 in Dare. April-September precipitation correlations are only +0.25 to +0.35 in the plain. Climate helps explain why the coastal plain can support dense, large bears. The growing season is long and crops are productive. It does not explain the speed of the rise. Harvest outruns every climate trend here.
the crop picture
The plain is serious cropland. Recent three-year means put Beaufort near 40,000 acres of corn and 68,000 acres of soybeans. Hyde and Washington each have about 31,000 corn acres, with 34,500 and 43,600 soybean acres. The mountain counties grow essentially none of these crops in the NASS record.
But this subsidy isn’t newly arriving. Corn and soybeans are flat to up, while Beaufort wheat falls from 47,000 to 27,000 acres and Washington peanuts from 2,500 to 1,300. Crops help explain size and carrying capacity. They don’t match the harvest curve as a growing driver.
the interactive explorer
the 1971 experiment
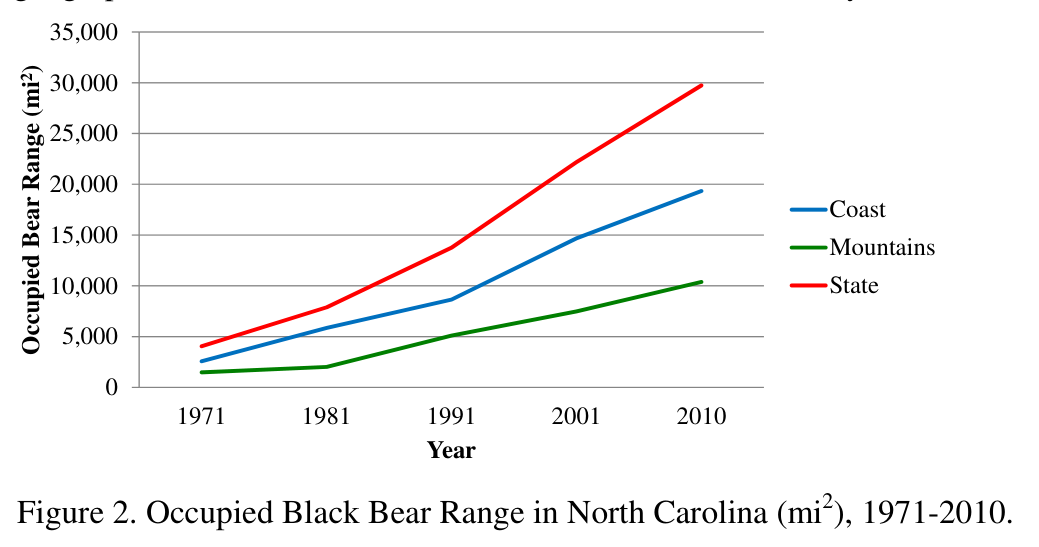
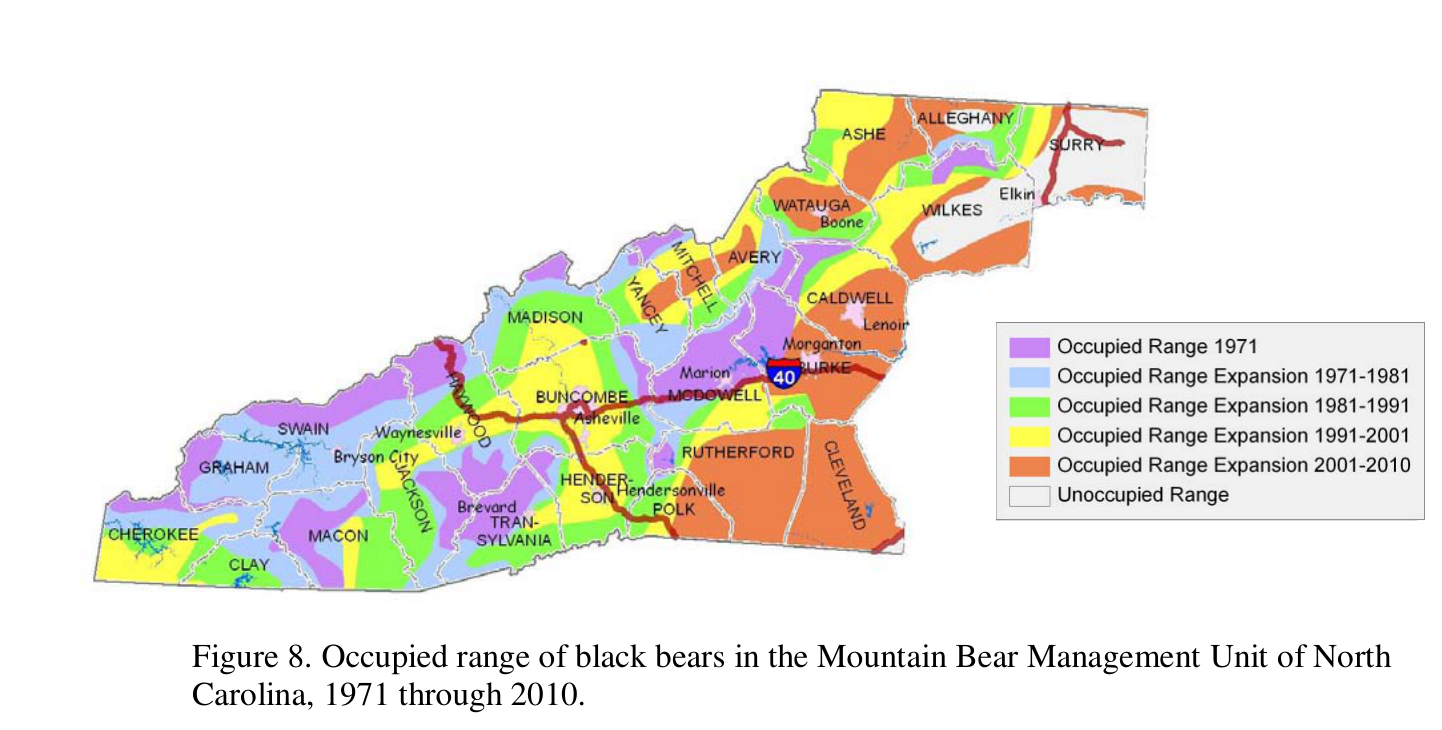
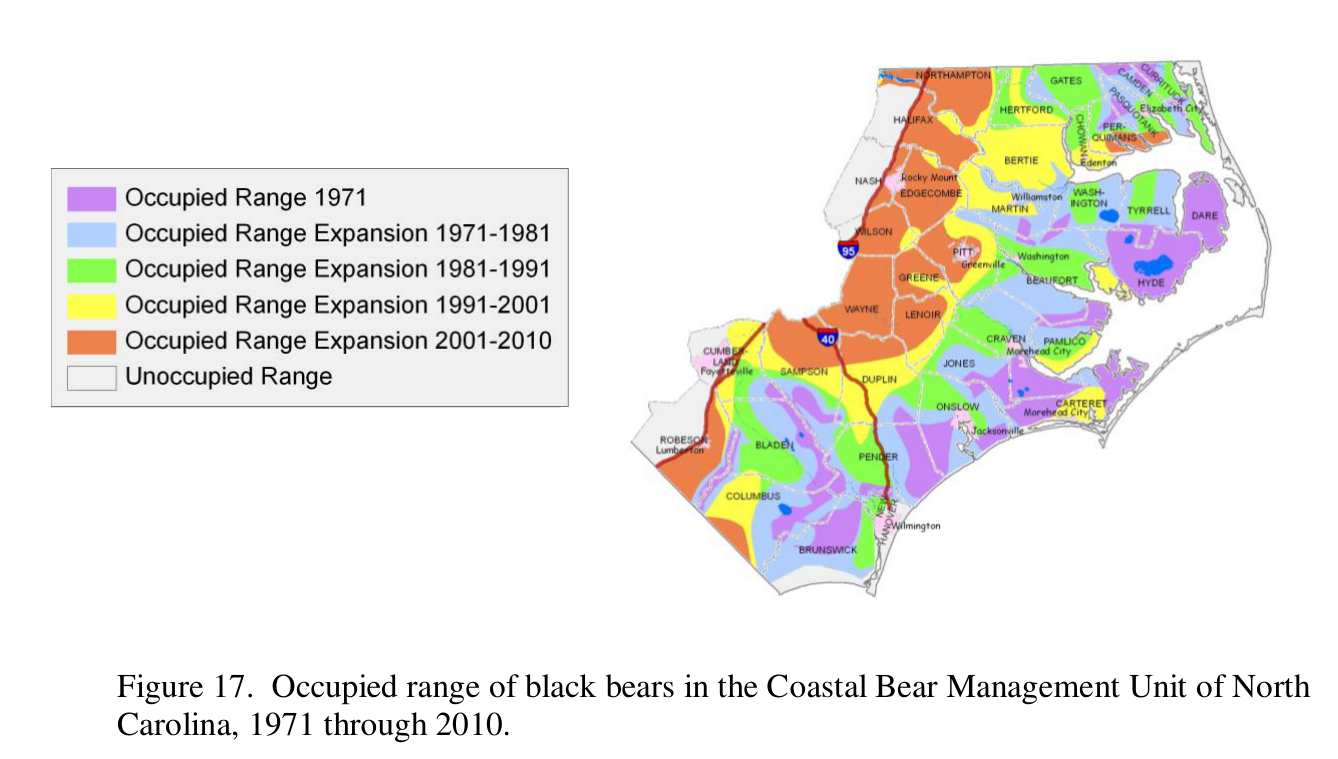
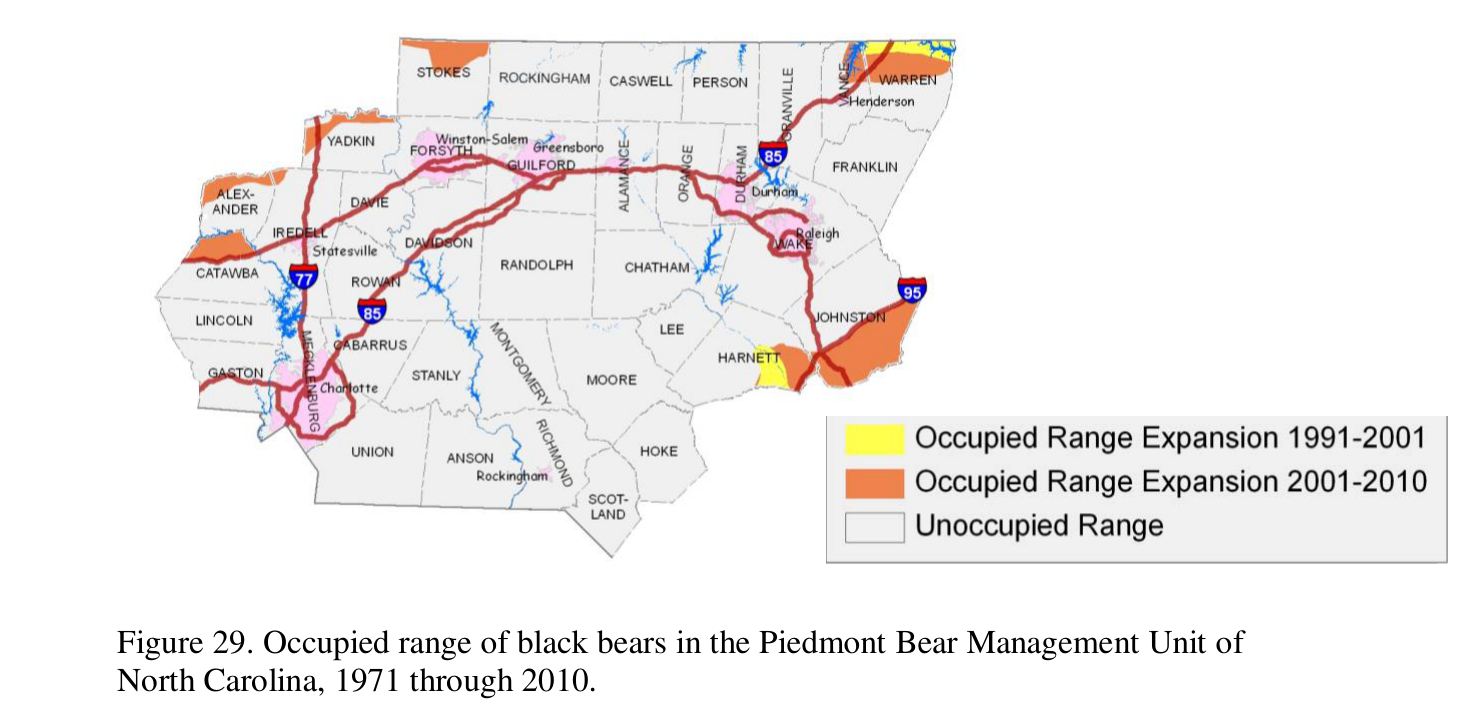
1971 is where this starts looking deliberate. The North Carolina Black Bear Management Plan 2012-2022 says the state created 28 sanctuaries, about 800,000 acres closed to bear hunting. It was the first such system in North America. The idea was to protect breeding-female core habitat so populations could “increase and expand into surrounding areas.”
The bag limit has stayed at 1 bear per day and 1 per season since 1971. Season lengths are managed by BMU. The plan estimates that harvest is maximized near 25-30% sanctuary coverage, with 75% of harvest occurring within 6 km of a sanctuary. Protect the core, hunt the spillover. The maps below are NCWRC’s record of occupied range spreading from 1971 to 2010.
Source figures: occupied range, NCWRC Black Bear Management Plan 2012-2022
reforestation or regulation
Forest comeback is the obvious alternative, except the measured record runs the other way. USFS Forest Inventory and Analysis puts statewide timberland at 18,178,157 acres in 2002 and 17,755,233 in 2024, down 2.3%. It peaked at 18,209,939 in 2003. In the overlapping record, seven-county harvest goes from 463 in 2002 to 1,160 in 2023, a 2.5× increase.
That doesn’t make habitat irrelevant. It means the data support regulation and management acting on habitat that was already productive, not forest regrowth within the measured period. Earlier forest recovery may have mattered, but this series cannot reach before 2002.
where the sanctuaries stand now
The current state rule lists 22 designated bear management areas: 16 with no open season and 6 with permit hunting. It is not a renamed copy of the original 28, and no published per-area establishment year or acreage lets me draw a one-to-one lineage.
The protected network is larger than the designation list. De facto protected lands add about 1.39 million acres. The Coastal BMU has about 1.1 million total sanctuary acres, only about 230,000 of them designated. As that footprint grew, Mount Mitchell opened to hunting in 2006 and Daniel Boone in 2009. The list moves. The protected-core strategy remains.
statewide today
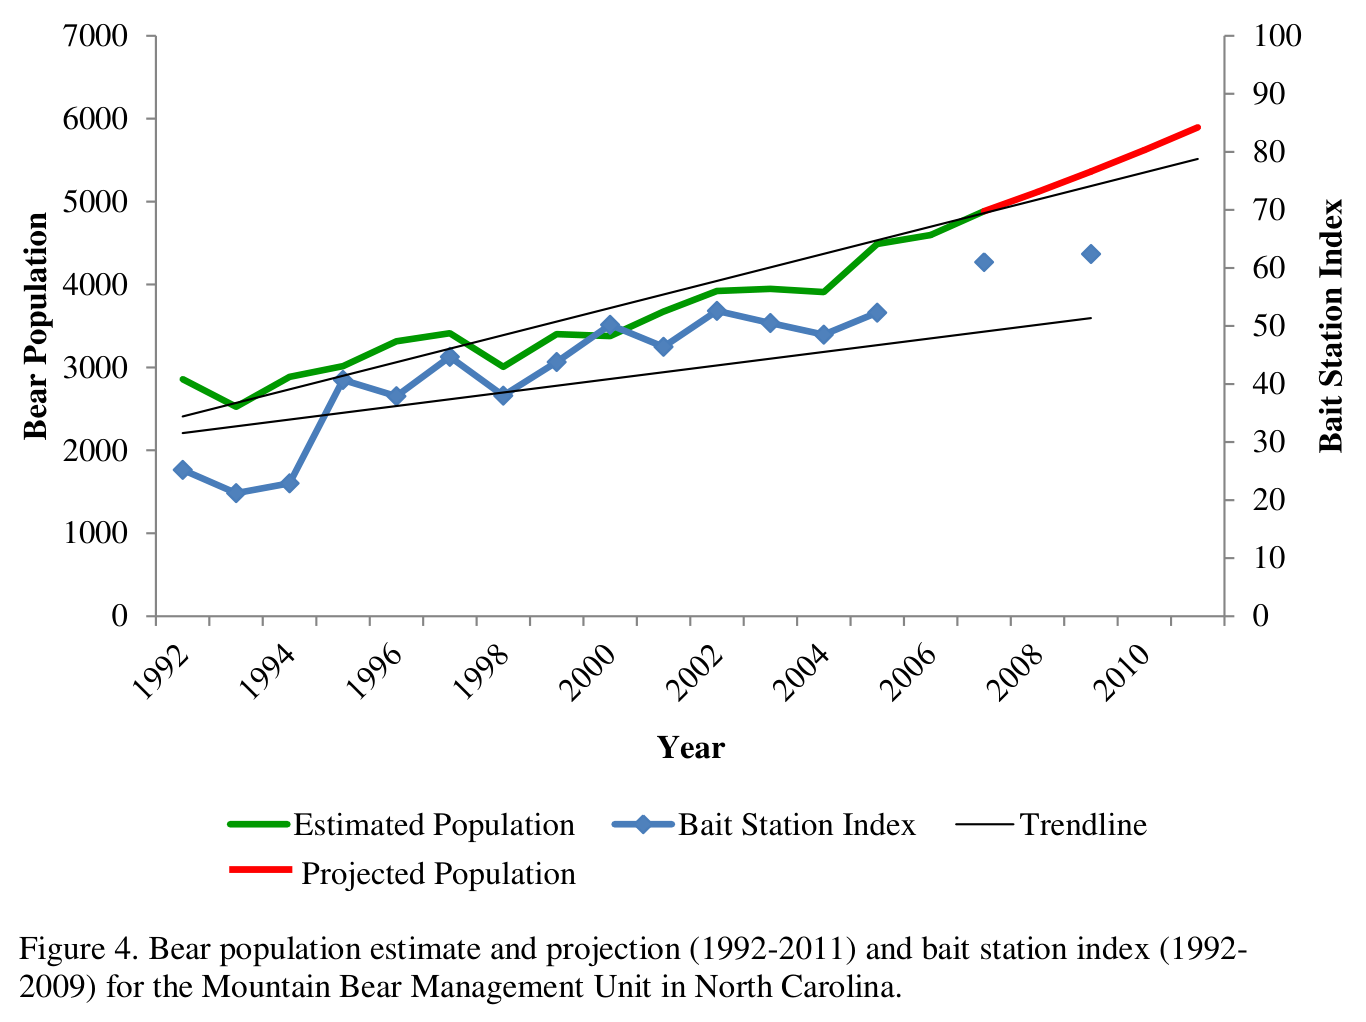
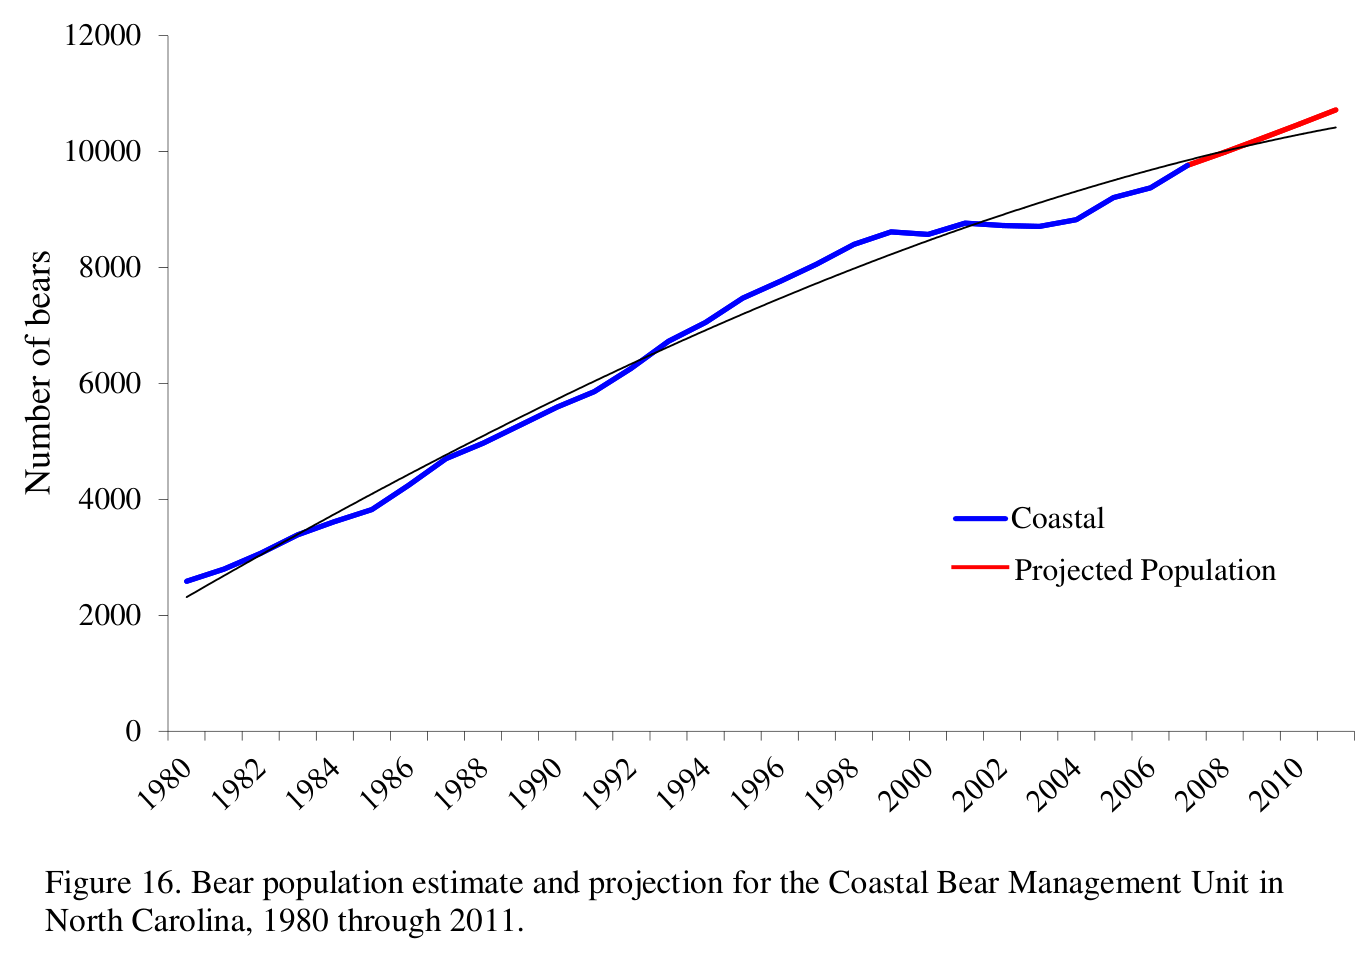
The exact statewide total is weirdly unsettled. NCWRC, as reported by WUNC, says over 20,000 black bears. NCpedia says 15,000. Those are conflicting public numbers, so I wouldn’t pretend the total is more precise than that.
The geography is clearer. The management plan puts the greatest densities in the central and northern coastal plain. NCWRC’s 2023 report calls Dare one of the densest bear populations in the United States. Within North Carolina, Camden, Hyde, Jones and Tyrrell had the most bears harvested per square mile that season, and the Coastal BMU supplied 63% of statewide harvest. DNA studies at Pocosin Lakes estimate 1.2 to 1.7 bears/km², among the highest densities reported in the literature.
Size follows the same pattern. Coastal males averaged 321-341 lb across the 2019, 2020 and 2023 seasons, versus 217-235 lb in the Mountains. Coastal females averaged about 200 lb. Weather and cropland help explain why bears can thrive there. The management record better explains why their range and harvest rose.
Source figures: population estimates, NCWRC Black Bear Management Plan 2012-2022
caveats
- bear weight figures are hunter self-reported and cover roughly a third to a half of harvested bears (Coastal BMU 32% in 2020, 54% in 2023; Piedmont 32% in 2020, 38% in 2023; Mountain BMU coverage not stated by NCWRC)
- weight/age are reported at Bear Management Unit level, not county level
- Hyde and Tyrrell counties have no in-county GHCN station; Ocracoke (37.8 km) and Edenton (38.0 km) are used as regional proxies and are labelled
regional_proxyin the data - climate coverage within 1997-2023 is incomplete for some counties (Hyde 11 of 27 usable station-years, Dare 17 of 27, Beaufort 19 of 27; Washington, Haywood, Jackson, Tyrrell 27 of 27)
- NASS crop survey coverage is thin in the mountain counties (Jackson and Haywood have very few surveyed county-years)
- NCWRC season-structure changes in 2014, 2016 and 2018 (bait rules, Sunday hunting, season lengthening) are harvest confounders, not population signals
- the 22 currently designated bear management areas (15A NCAC 10D .0106, amended March 2023) are not the same set as the 28 sanctuaries established in 1971; no per-area establishment year is published
- no per-area acreage is published in the rule; only statewide aggregates are available
- occupancy-by-decade and population figures are embedded as NCWRC’s published images because no numeric series is published for them
- FIA timberland coverage begins in 2002; the pre-2002 periodic evaluations are not retrievable, so the numeric forest series does not reach back to 1971
- statewide population totals conflict across sources (NCWRC/WUNC “over 20,000” vs NCpedia 15,000)
sources
- NCWRC 2023 annual bear report
- NCWRC 2012 annual bear report ( Wayback)
- NCWRC 2019 annual bear report ( Wayback)
- NCWRC 2020 annual bear report ( Wayback)
- NOAA GHCN-Daily
- USDA NASS Quick Stats bulk files
- County boundaries: Census cartographic county boundaries, 7-county extract keyed by FIPS
- North Carolina Black Bear Management Plan 2012-2022 and Appendix A
- NCWRC black bear brochure
- 15A NCAC 10D .0106, designated bear management areas
- USFS Forest Inventory and Analysis, FIADB-API
The county dataset, pipeline, and rebuild instructions are documented in this post’s bundled README.