Research figures
Heat & flood hazard
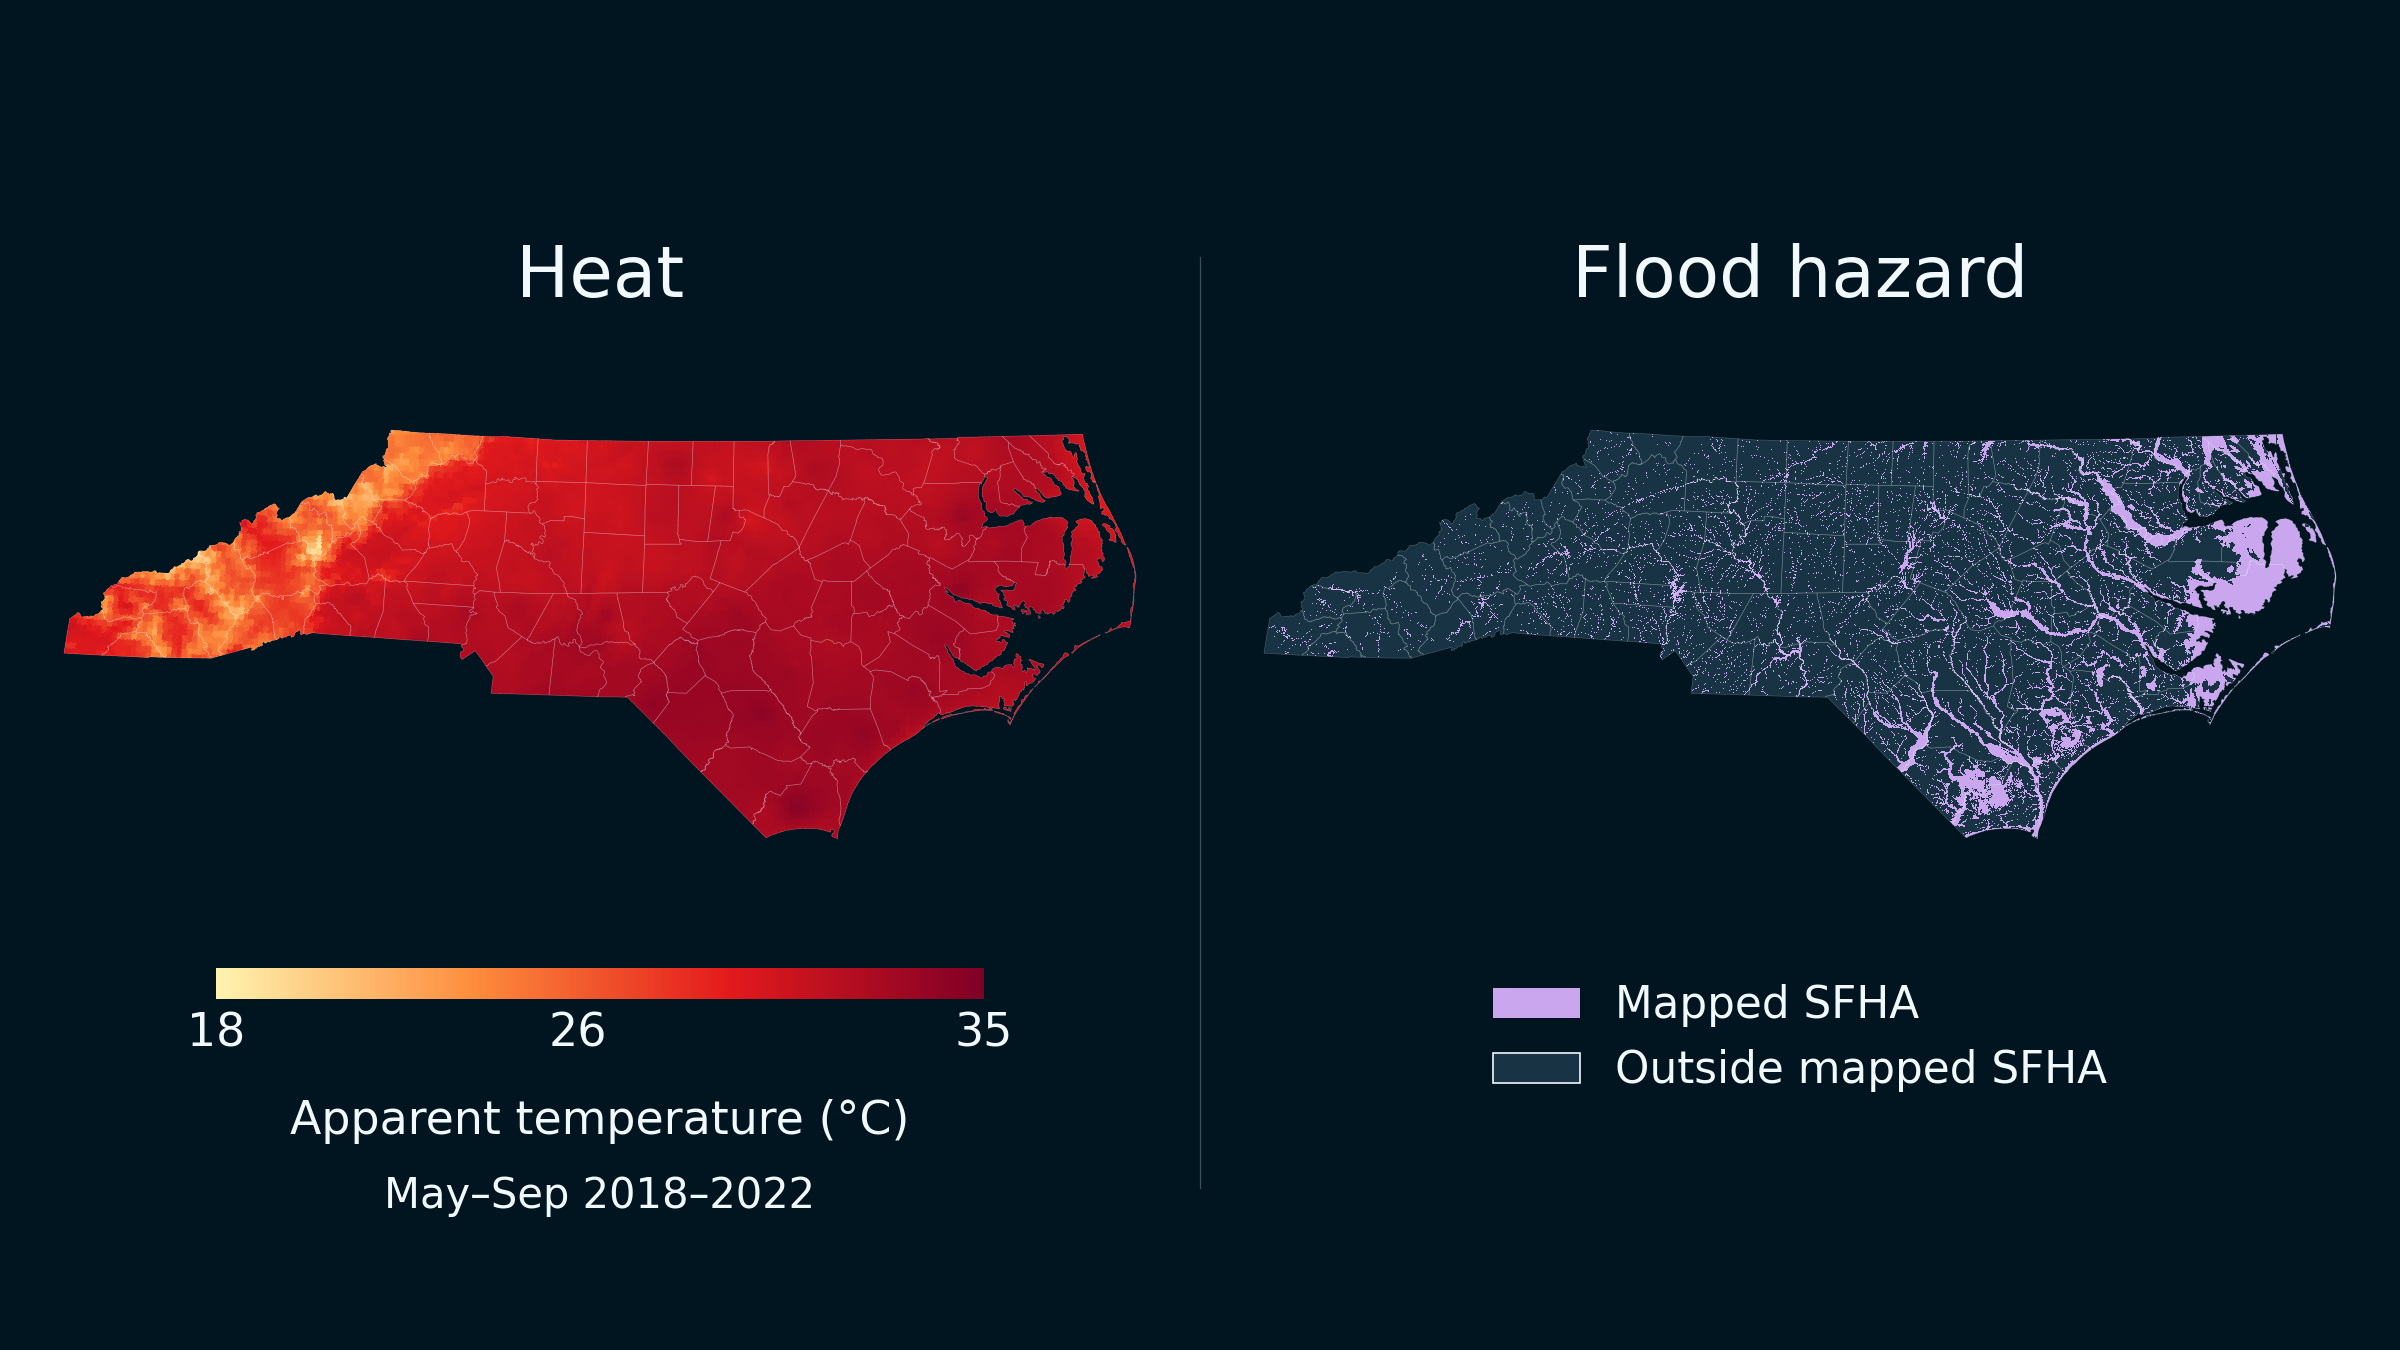
Two statewide North Carolina maps share the same geographic frame. Left: mean May–September apparent temperature for 2018–2022, displayed in H3 cells on an 18–35 °C scale; H3 is not the native PRISM resolution. Right: the FEMA Special Flood Hazard Area footprint from an existing 100 m raster. Purple marks mapped SFHA flood hazard, not an observed flood event; areas outside the mapped SFHA are not necessarily free of flood hazard.
Mobility over time

Two mobility networks connected by an arrow show changing movement over time. The same locations appear in both panels, while connections and flow directions change. These are illustrative flows, not measured migration data.
Comparative effectiveness
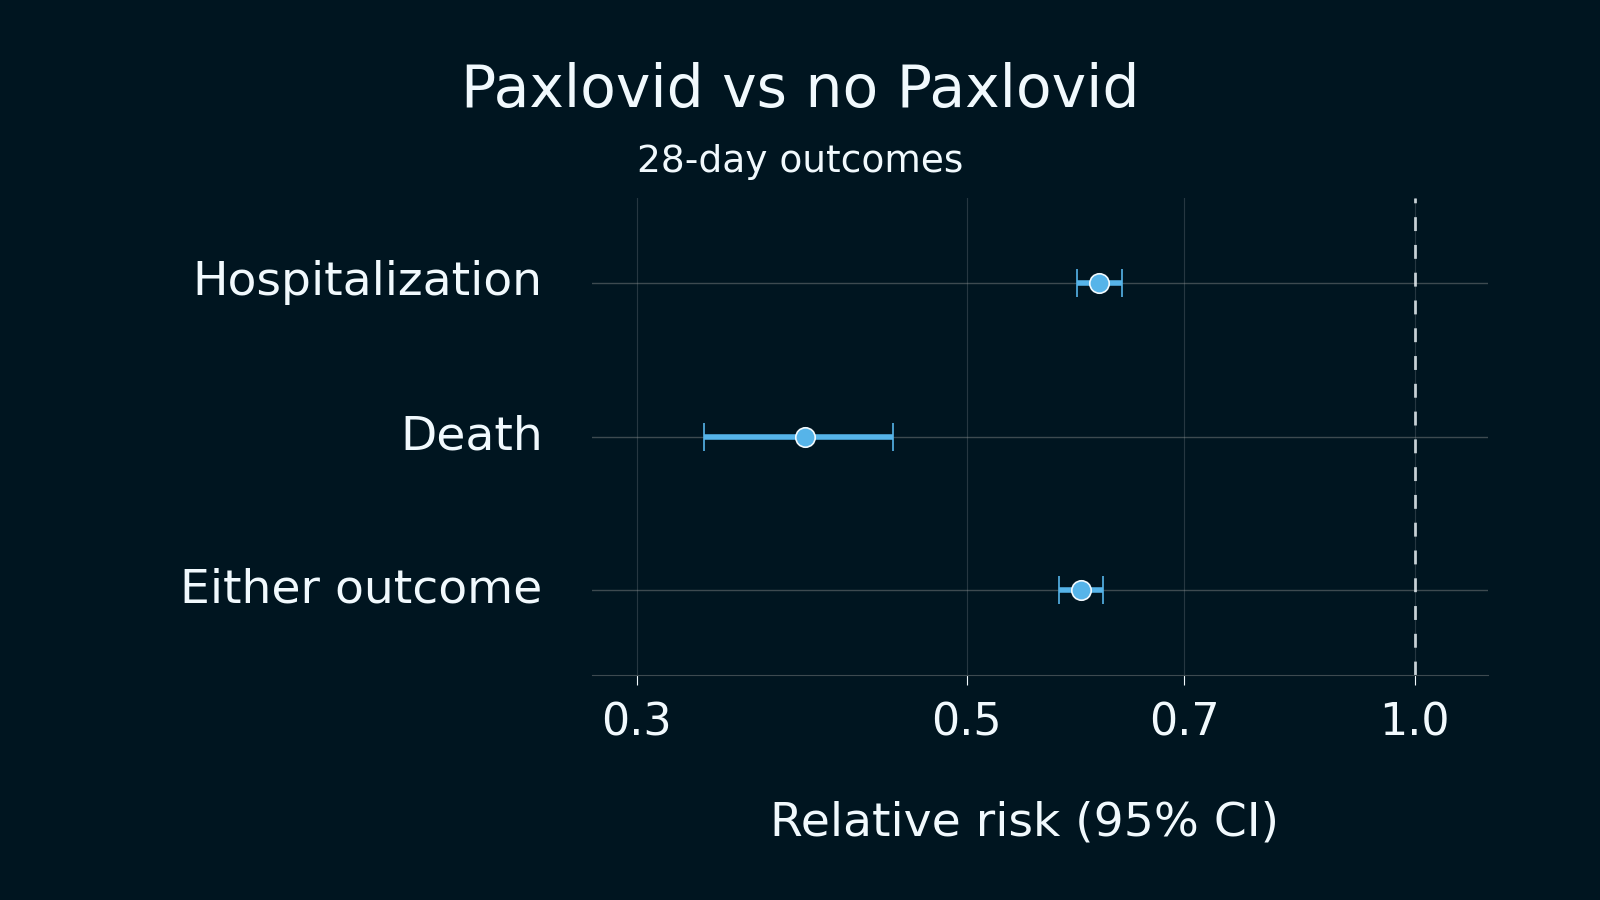
Forest plot of three published overall-analysis estimates from one observational target trial emulation, comparing a Paxlovid prescription within five days of the COVID-19 index with no prescription in that window. Relative risks and 95% confidence intervals are 0.614 (0.593–0.636) for hospitalization, 0.389 (0.333–0.446) for death, and 0.597 (0.577–0.617) for hospitalization or death at 28 days. All intervals appear on a logarithmic relative-risk axis with a null reference at 1. These are three outcomes from the same cohort, not a meta-analysis.